
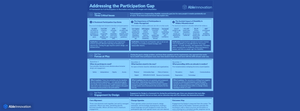
This is one of four foundational publications from Able Innovation. Together they set out the case, the evidence, the vocabulary, and the international lessons for closing the participation gap in adaptive sport and recreation. This infographic states the case. It provides an important visual narrative around the importance of adaptive sport and recreation, and the need for a structured approach to improve engagement.
Five things to know
- The participation gap is real, but nobody tracks it well enough to close it.
- People with disabilities are 16–62% less likely to meet activity guidelines.
- 67% want to be more active, but only 52% feel they have the chance (UK).
- 0 of 194 countries have comparable data on disability and activity.
- Increasing participation would have a positive impact.
- 3.6× higher health care spending for adults with disabilities, adjusted for age.
- 50% higher odds of chronic disease for inactive adults with disabilities.
- 21% lower economic cost for active people with disabilities (Korea).
- The community is bigger, older, and less visible than most programs assume.
- 1 in 4 people has a disability, and 2 in 3 are affected by it.
- About 9 in 10 adults with disabilities use no visible aid.
- Fewer than 8% are children, yet much provision targets childhood.
- Closing the participation gap is a design issue.
- 4 needs: safety, independence, dignity, and access.
- 6 barriers that compound each other, so fixing one isn’t enough.
- 5 shifts already under way that reward organizations who anticipate them.
- Engagement by Design is a framework for closing the participation gap.
- 3 core elements: communications, experience, and technology.
- 3 change agendas: Discovery, Journey, and Scalability.
- Outcomes measured from day one.
Most figures come directly from published research. Three are Able Innovation estimates.
Able Innovation document #2026INFA01